

Reimagining Talent Supply Chain based on Empirical Research and Practice Evidence
A measurement architecture that treats HR as a supply chain — with the same rigour your operations team gives to manufacturing yield, inventory quality, and throughput. Built on 16 years and 200+ enterprise implementations.

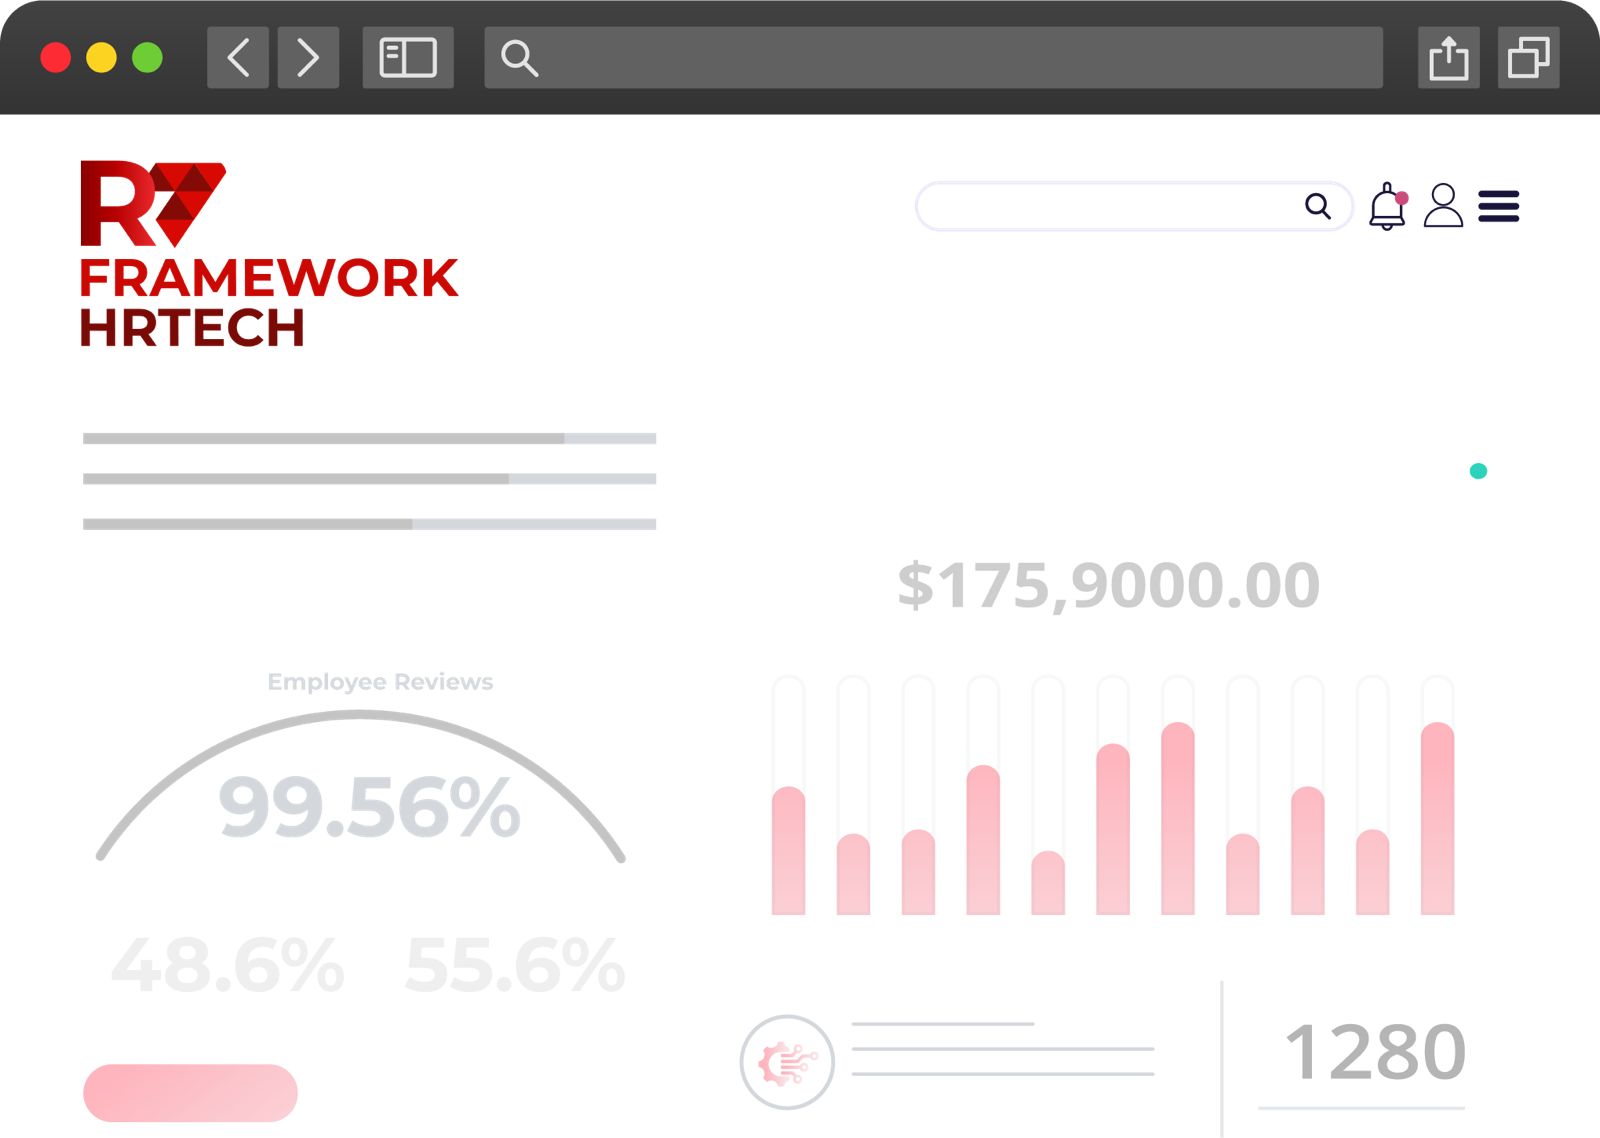
Your most expensive supply chain has no yield metric.
Talent represents 70% of operating costs — yet no organisation measures its yield rate, defect cost, or throughput the way manufacturing does. R7 changes that by introducing a role-relative definition of performance: an A-Player is someone who consistently exceeds expectations in their specific role's KPIs.
A-Players in revenue-critical roles drive customer acquisition — which drives revenue. A-Players who stay in those roles compound institutional knowledge and drive customer retention — which drives profit. Two board metrics capture everything: % A-Players in Critical Roles and A-Player Tenure in Critical Roles.
Everything else in HR — policies, programs, technologies — exists to move these two numbers.
Same industry. Similar scale. Different outcomes.
Company A
Company B
Seven quality control stations.
If any station fails, your final yield suffers — no matter how good the other stations are. Each R is a checkpoint where A-Player composition either increases or decreases.


The R7 conversation is growing.

Extending the Value Stick into Talent Markets
In Better, Simpler Strategy, Prof. Felix Oberholzer-Gee argues that firms create competitive advantage through two mechanisms: raising customer willingness-to-pay and lowering employee willingness-to-sell. The customer side of this equation has decades of CRM systems, NPS scores, journey analytics, and revenue attribution models.
This asymmetry creates a specific research question: can systematic talent measurement infrastructure enable organizations to lower employee willingness-to-sell through better role-person fit, rather than through compensation? When employees are matched to roles where they consistently exceed expectations, intrinsic satisfaction rises — reducing the compensation premium required to retain them.
R7's measurement architecture — tracking talent quality, conversion rates, and retention across seven lifecycle stages — provides the empirical infrastructure to test this hypothesis at scale.
Andreas Andresen Professor of Business Administration, Harvard Business School
Serves as research advisor to R7's empirical validation program. The collaboration focuses on co-developing a research survey instrument examining how systematic talent measurement infrastructure enables organizations to build differentiated Employee Value Propositions — extending the Value Stick framework into talent markets.
Focus area: EVP & Talent Market Differentiation
Method: Large-scale cross-sectional survey of senior HR leaders across industries and geographies in Asia-Pacific
Survey instrument finalized. Data collection forthcoming.
The principles behind the framework.
The Human Side
The business cares about the role: based on the last 12 months, is this role performing? But the professional cares about their career: Am I growing? R7 creates the equilibrium — we only hire you if we believe you fit the role, but the moment you are selected, your career is set.
An A-Player is someone who consistently exceeds expectations in their specific role's KPIs over the last 12 months. A top-performing warehouse supervisor is an A-Player exactly as much as a top-performing CFO.
The Measurement Architecture
L1 — Board Outcomes
% A-Players in Critical Roles (target: 60%+) and A-Player Tenure in Critical Roles (target: 5+ years)
L2 — Operational Levers
Quality of Hire, Regrettable Attrition, B→A Conversion, C-Player %, Internal Mobility...
L3 — Flow Diagnostics
New Hire A-Player Rate, Rating Calibration Accuracy, C-Player Exit Velocity — by Role Category
L4 — System Parameters
197 functional + 15 non-functional HRTech capabilities: skills taxonomy, attrition prediction, AI matching...
The enablement chain flows bottom-up: L4 enables L3, L3 drives L2, L2 determines L1. The diagnostic chain flows top-down: trace any board-level problem to the exact system capability that is missing.
The Self-Healing System
VALIDATED ✓
L1 HIGH + Business HIGH. Your definitions work. Keep measuring.
DEFINITIONS WRONG ⚠
L1 HIGH + Business LOW. Fix A-Player definitions or Critical Role designations.
MEASUREMENT GAP
L1 LOW + Business HIGH. You're not measuring the right things. Recalibrate.
REAL TALENT PROBLEM ✗
L1 LOW + Business LOW. Genuine A-Player deficit. Act now.
Not just theory. Field-tested applications.
R7 HRTech ROI
Quantifies the dollar impact of talent gaps using a 10×10 matrix: 10 Hidden Costs × 10 Value Drivers. 37 input parameters. Phase-based value ramp. Role criticality multipliers.

R7 Health Check
"We bought the system. Is it working?" 5+1 diagnostic model. Five objective inputs, one derived output. Two-tier assessment with 36 root cause taxonomy.
R7 HRTech Selection
Vendor selection based on YOUR fit, not analyst rankings. 212 parameters weighted by YOUR business priorities. Vendor capability scored independently.
R7 AI Navigator™
13 Universal AI Agents every enterprise needs. 5 PLAN + 8 PREDICT. Scored across 5 dimensions on 0–10 scale. Three modes: Assess → Plan → Monitor.
Ready to measure what matters?
R7 was created for one purpose: to drive the world's professional productivity. By giving HR the same measurement precision that every other function already has.
For CHROs & HR Leaders
A 45-minute private walkthrough tailored to your organization's talent supply chain.
Request BriefingFor Researchers
Participate in the empirical study validating the R7 hypothesis across organizations in Asia-Pacific.
Join the ResearchFor Everyone
Subscribe to "HR is NOT a Cost Center" — the newsletter that challenges how you think about talent.
Subscribe